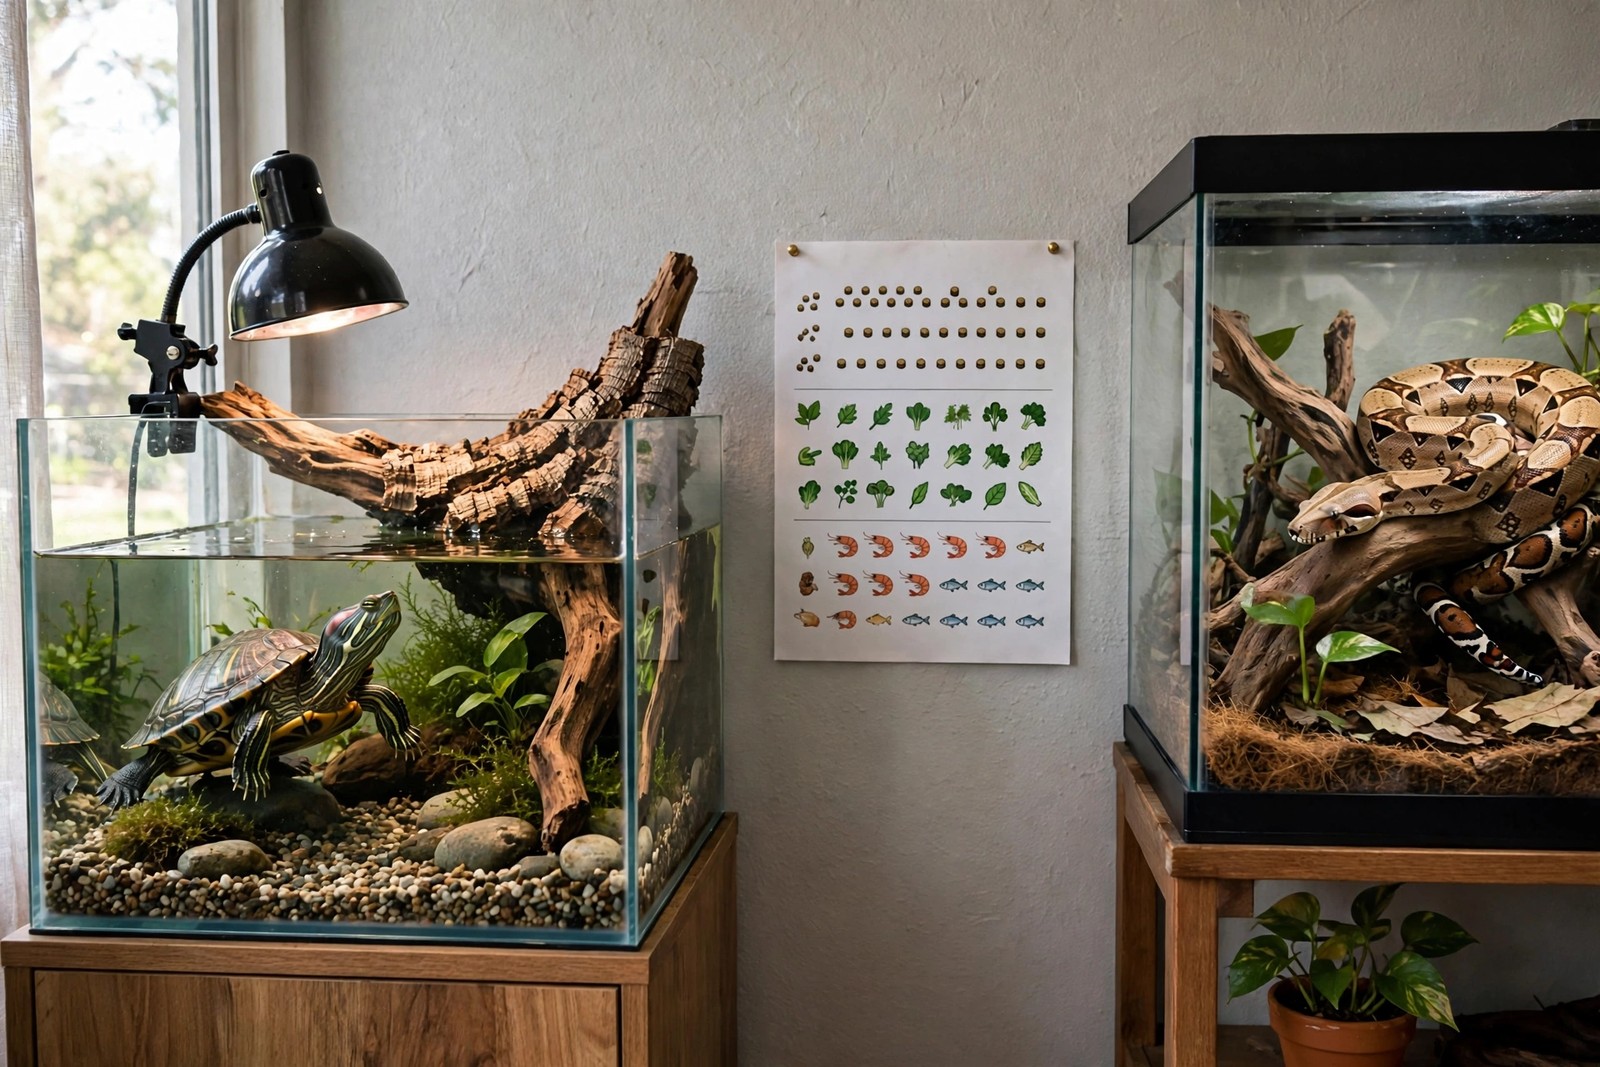
Once a red-eared slider moves past a single-food diet, memory stops being a reliable feeding system. Pellets on some days, greens daily, protein now and then, calcium somewhere in the week — without a chart, protein quietly becomes a daily habit and greens quietly disappear, and the slider's diet drifts lopsided while every individual meal looked fine. A feeding chart fixes that by giving each food group its own column, so the balance of the whole week is visible at a glance.
The Columns for Each Food Group
Build the chart with these columns, in this order: the day; pellets, recording the type and the amount offered; greens, recording which green was offered; protein, recording the type or the word none; supplements; and notes. Greens rotate — dandelion greens, turnip greens, red-leaf lettuce and similar leafy foods — and writing the type down stops the chart hiding a rut where one green is served for a month. The protein column matters most: earthworms, small pieces of cooked plain fish or shrimp, and occasional live foods all belong there with their amounts, so a treat cannot sneak into becoming a staple. In the notes column, record what was actually eaten and what was left, because the chart's value lies in the gap between offered and eaten.
A Week the Chart Has To Show
The pattern the chart should reveal depends on age, because sliders shift from protein-hungry youngsters toward plant-leaning adults. For an adult, a typical week shows greens offered every day, pellets on three days of the week, and protein on two days of the week, with the remaining days carrying greens alone. For a juvenile, the same columns show protein on every day and pellets daily in smaller amounts, alongside greens offered daily so the habit forms early. Laying the week out this way exposes mistakes instantly: if the protein column fills in on five days for an adult, or the greens column shows gaps for a youngster, the chart has caught the drift before the slider's shell and weight do.
Supplements and Weight Belong on the Same Chart
Add the supplement column beside the food columns rather than in a separate notebook. Record calcium dusting on the days it is given and note a weekly cuttlebone check — present, nibbled, or needing replacement — so mineral intake is tracked with the meals it supports. Below the daily rows, keep a weekly weight line: weigh the slider on the same day each week, out of the water, and write the figure beside that week's rows. Weight is the chart's referee. A slider gaining steadily on a protein-heavy pattern, or an adult whose weight climbs while its greens column thins, is showing you the adjustment to make — trim the protein days first, not the greens.
Reviewing the Chart Like a Vet Would
Once a month, read down each column rather than across each day. Column reading shows proportions, which is what diet health actually is: greens forming the adult's daily base, pellets measured rather than scattered freely, protein present but occasional, supplements regular. Bring the chart to vet visits, because a month of columns answers questions about appetite, growth and shell condition that memory cannot. Photograph the chart at the end of each month before you start a fresh page. The photograph preserves the record if the paper copy is splashed or lost, and a run of monthly photographs lets you compare proportions across seasons, when appetite and growth naturally shift, without digging through a drawer of loose sheets. KinsLe's Pet Passport holds the chart alongside your slider's weights and health notes as one portable record, so the feeding history is complete and legible whenever a new vet or a holiday keeper needs it.